
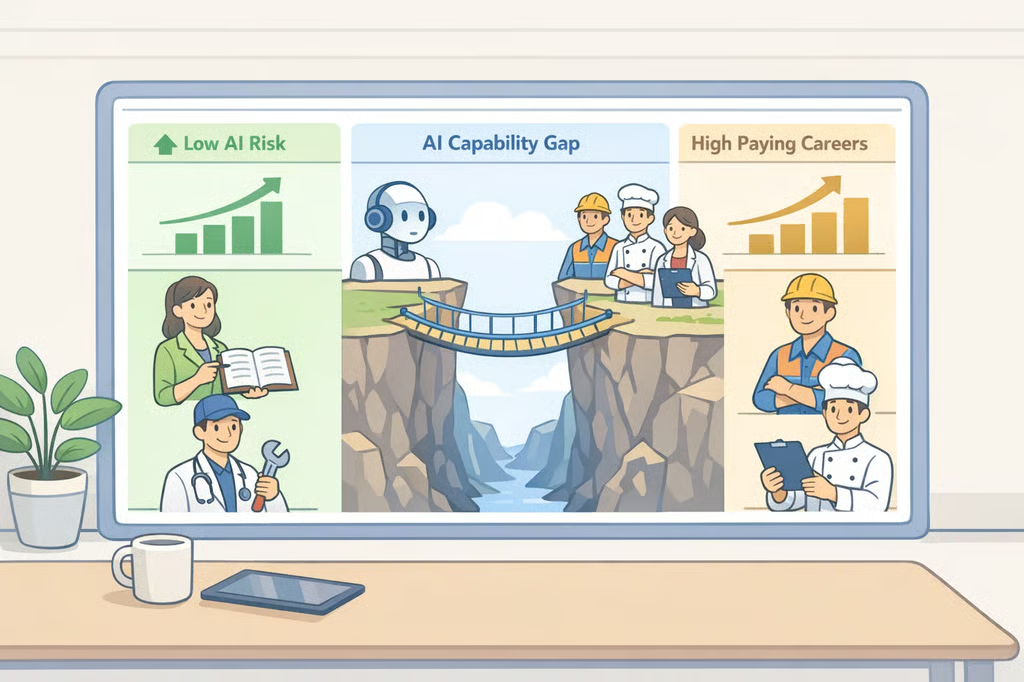
- High-paying jobs with low AI risk: what OECD data reveals
- What the OECD's capability-gap measure shows, and where it stops
- Why researchers say older exposure scores can mislead
- A framework for low AI exposure careers beyond a single score
- Applying the framework: registered nurses and physicians
- What to verify before the next career move
High-paying jobs with low AI risk: what OECD data reveals
In late May, the Organisation for Economic Co-operation and Development released a new measure that scores occupations by comparing current AI capabilities against nine cognitive, social, and physical job requirements, according to the OECD. The result, which the OECD calls an AI Capability Gap, is not a verdict on whether any specific job will disappear, according to the OECD.
For anyone researching high-paying jobs with low AI risk, that distinction matters. The OECD material reviewed for this article doesn't provide a cited, role-level score for occupations such as registered nurse or physician. What it offers instead are task patterns tied to lower exposure today, not a ranked list of protected jobs.
The OECD built the measure as a forward-looking, updateable way to track how AI capabilities and job requirements might shift over the next five to 10 years, not a snapshot of what any single employer is doing right now, per the OECD. A preprint posted about six weeks ago by Campbell Lund, Thomas Euyang, Zanele Munyikwa, and Marzieh Fadaee argues that older exposure scores calculated in 2023 became a central input to the future-of-work debate, and that the limitations their original authors flagged rarely traveled with the numbers as they spread into policy and hiring conversations (Lund et al., arXiv).
This article builds a four-step framework for weighing AI exposure against pay, licensing, and training cost, then applies it to two related healthcare roles. "High-paying" here means wages meaningfully above the median for all U.S. occupations. That median stood at $49,500 in May 2024, the figure used consistently for the healthcare comparison below (BLS). A newer BLS wage survey, released about three months ago, puts the mean annual wage across all occupations at $69,770 for May 2025, a different measure than the median cited here (BLS).
What the OECD's capability-gap measure shows, and where it stops
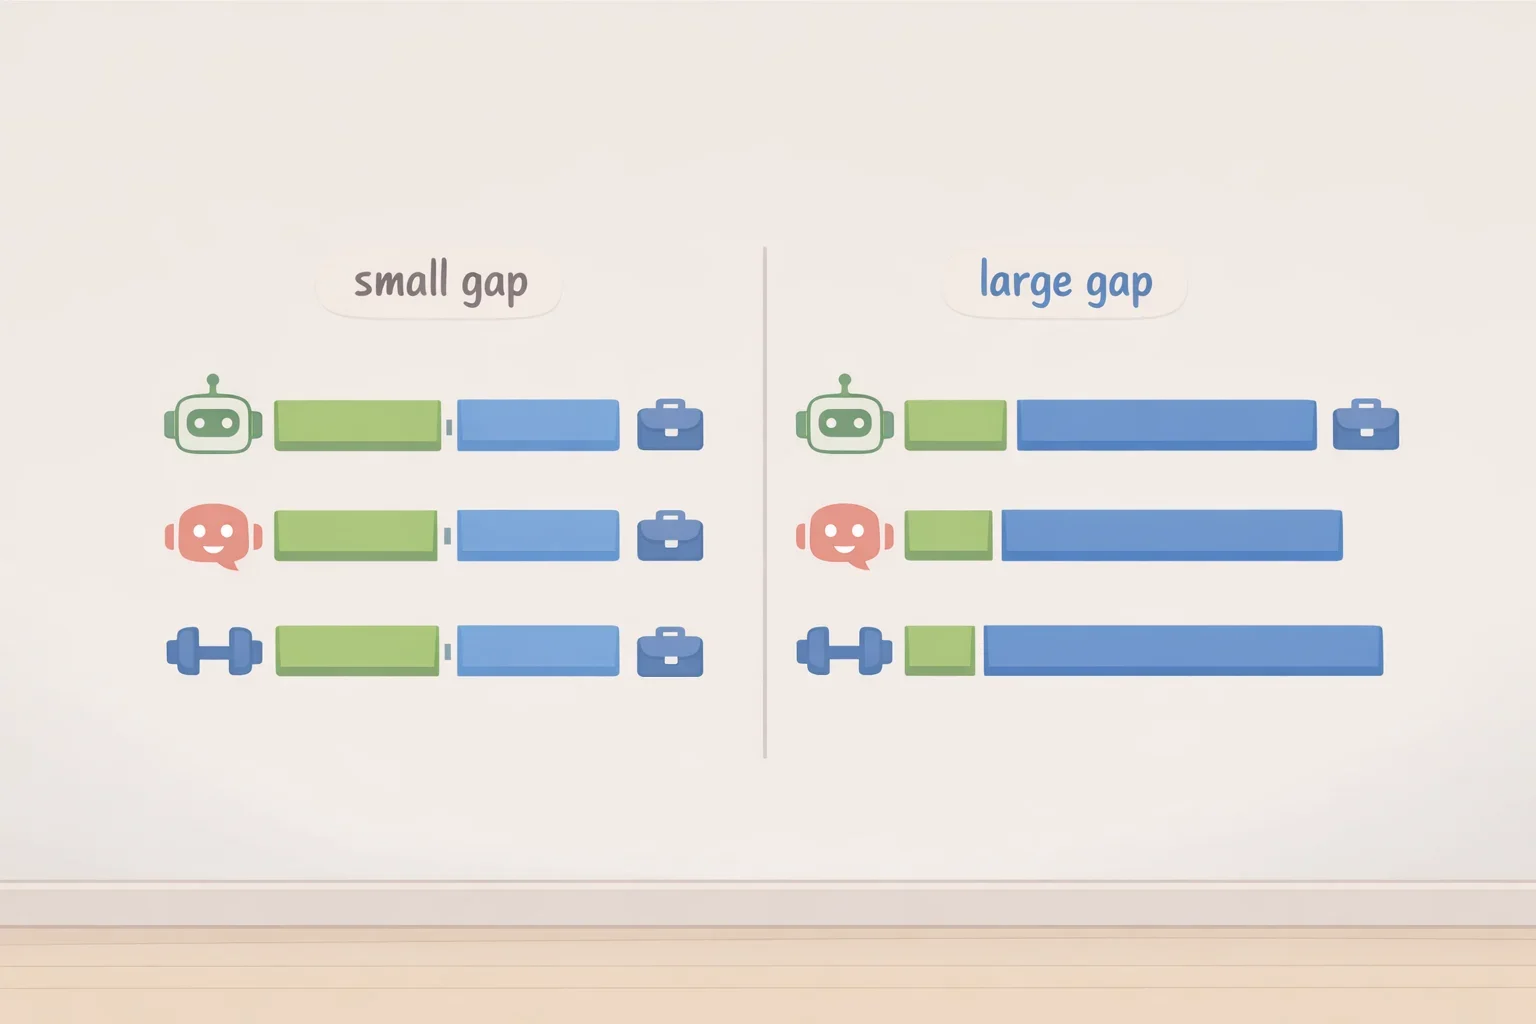
The measure maps AI capabilities across nine cognitive, social, and physical domains against what a given occupation actually requires, then converts that comparison into a capability-gap index, according to the OECD. A smaller gap signals higher potential exposure. A larger gap signals lower potential exposure.
Current AI capabilities sit closest to occupations built around routine information processing, administrative work, and codifiable tasks, and furthest from occupations requiring contextual judgment, interpersonal understanding, complex decision making, and responsibility, the OECD's findings show. Exposure also varies by type of AI: some occupations face more pressure from language and reasoning systems, while others are more exposed to robotics, machine vision, and other embodied AI, per the same OECD analysis.
That capability gap isn't the same thing as confirmed task assistance, task transformation, or job loss. The OECD frames the measure as a foundation for analyzing how tasks might transform and how skill demand might shift, but notes that actual labor-market effects depend on adoption, regulation, organizational change, and social choice, not the capability score alone (OECD). A low gap doesn't mean a job is scheduled for automation. A high one doesn't guarantee immunity from AI-driven task redesign, either.
Why researchers say older exposure scores can mislead
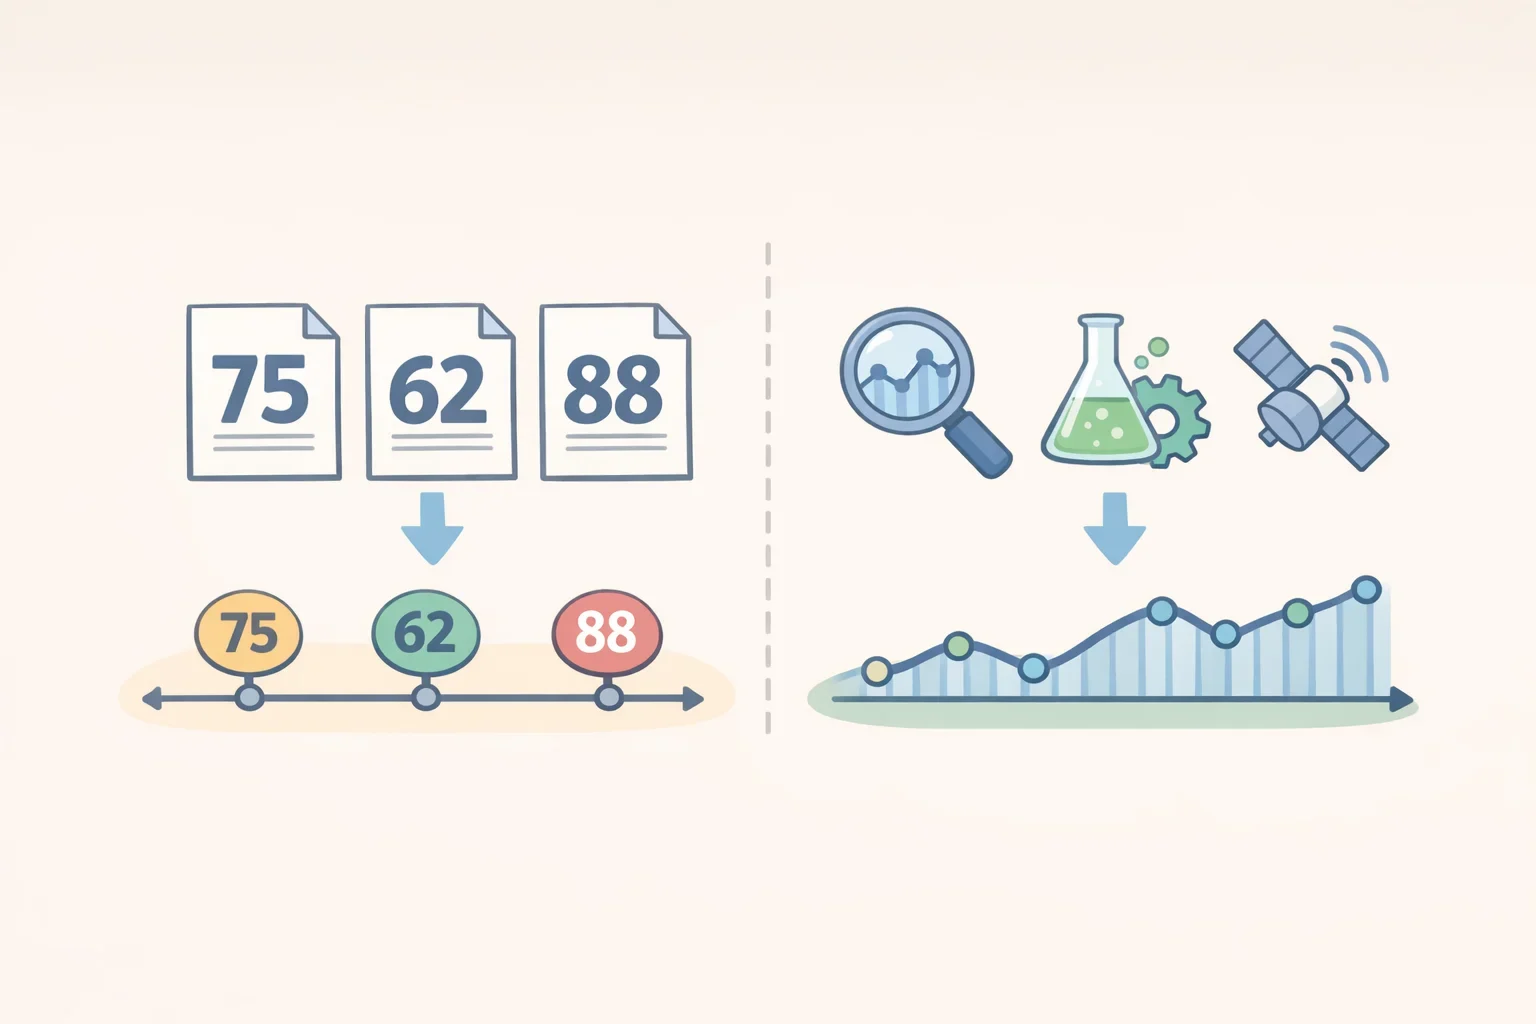
The 2023 scores that Lund, Euyang, Munyikwa, and Fadaee examine were produced by Eloundou and colleagues, who defined exposure as the share of an occupation's tasks a large language model could assist with (Lund et al., arXiv). The researchers call that original work a genuine methodological contribution, but argue its caveats got dropped as the numbers spread into policy and hiring conversations (Lund et al., arXiv).
Two gaps have widened since, the preprint argues. One is structural: static exposure scores capture a fixed moment, while policy and career questions require tracking how a job's task mix actually shifts over time (Lund et al., arXiv). The other is a coordination gap between researchers and policymakers, who the authors say keep citing the 2023 figures without incorporating newer methodological work that could answer questions about who is affected, and how, more reliably (Lund et al., arXiv).
The preprint surveys five newer research families responding to that gap: dynamic and benchmark-based measures, ensemble methods, task-framework extensions, worker-centered metrics, and adoption and usage data (Lund et al., arXiv). It's a preprint awaiting peer review, not a confirmed finding, so that caveat carries through everything drawn from it here. Combined with the OECD material, the sources reviewed for this article still don't include a cited role-level exposure score for occupations such as registered nurse, physician, paralegal, or software developer.
A framework for low AI exposure careers beyond a single score
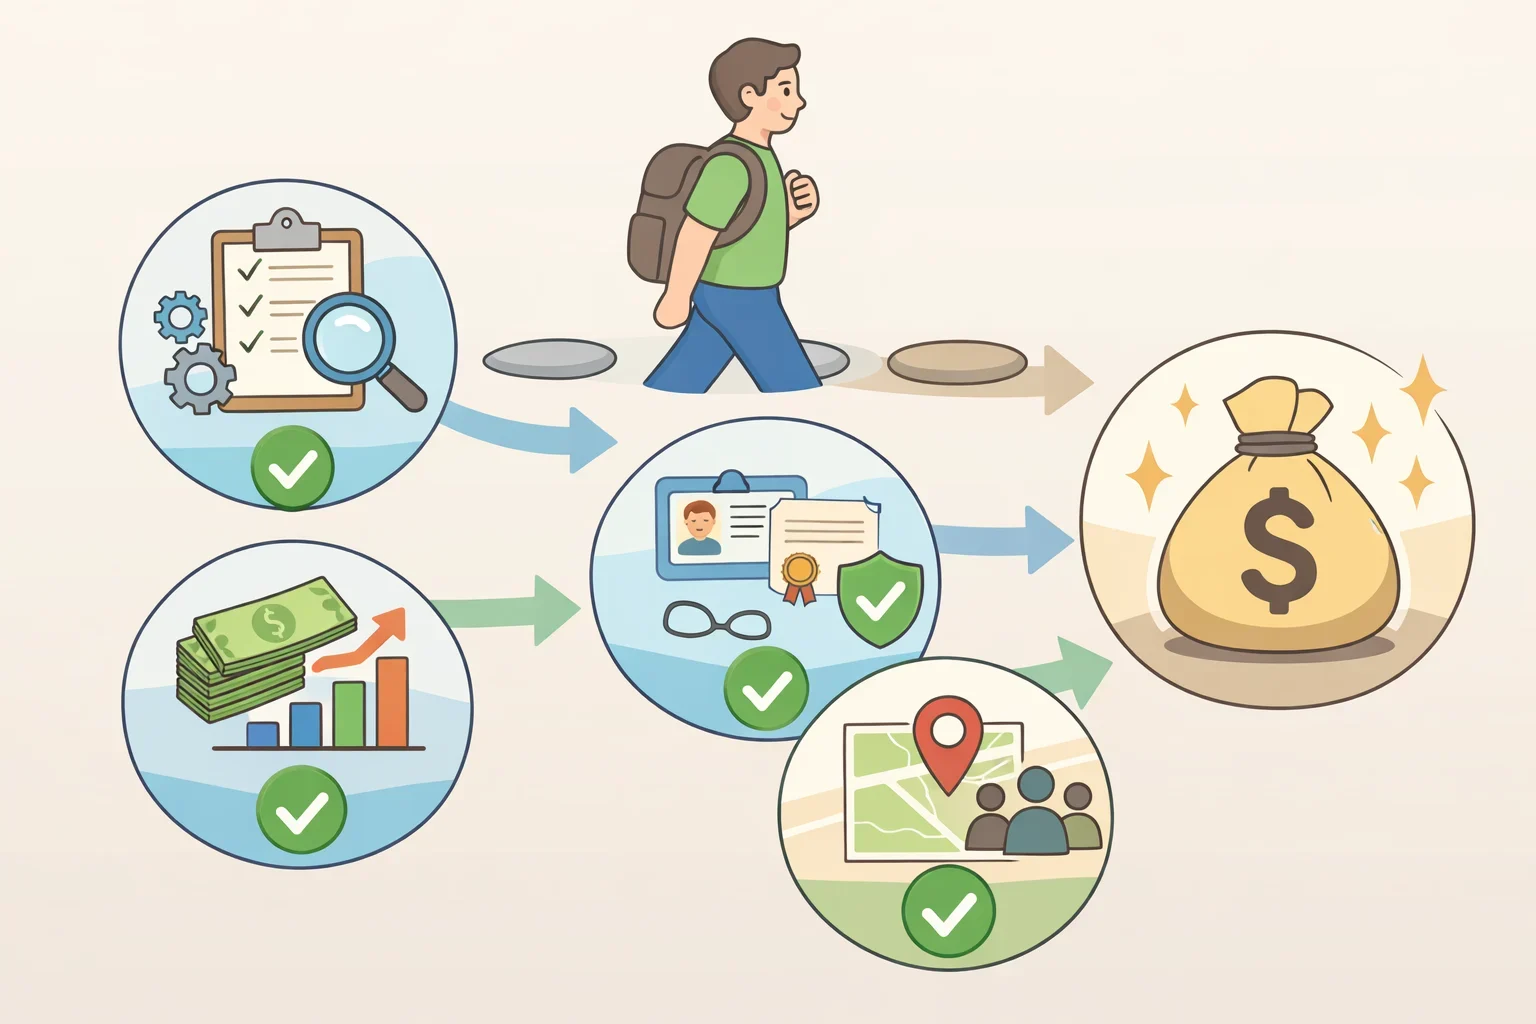
With no occupation-specific exposure score available for the roles examined here, this article uses four checks in place of one number:
- Task mix. Whether daily work leans toward routine documentation and information processing, or toward in-person judgment and relationship-based work, can be sketched using an occupation's task list on O*NET. O*NET catalogs work activities rather than AI risk, so treat it as a starting profile. Current job postings show what employers say they want from applicants, a useful cross-check on stated requirements, though not evidence of how AI is actually used day to day.
- Entry requirements. Whether a license or certification is legally required, and whether that requirement varies by state, is worth confirming directly with the relevant state licensing board rather than assuming national rules apply everywhere.
- Training investment versus starting pay. How long a required program runs and what it typically costs, measured against entry-level pay rather than the occupation-wide median, gives a clearer read on payback time. Earnings within any single occupation vary by experience, responsibility, tenure, and location (BLS).
- Local demand. Current openings in a specific metro area differ from national growth projections. BLS's occupational projections run through 2034 (BLS), a national figure that won't reflect a single city's or employer's hiring right now.
These four checks don't combine into a single score. They replace one potentially stale number with separate questions a reader can verify directly.
Applying the framework: registered nurses and physicians
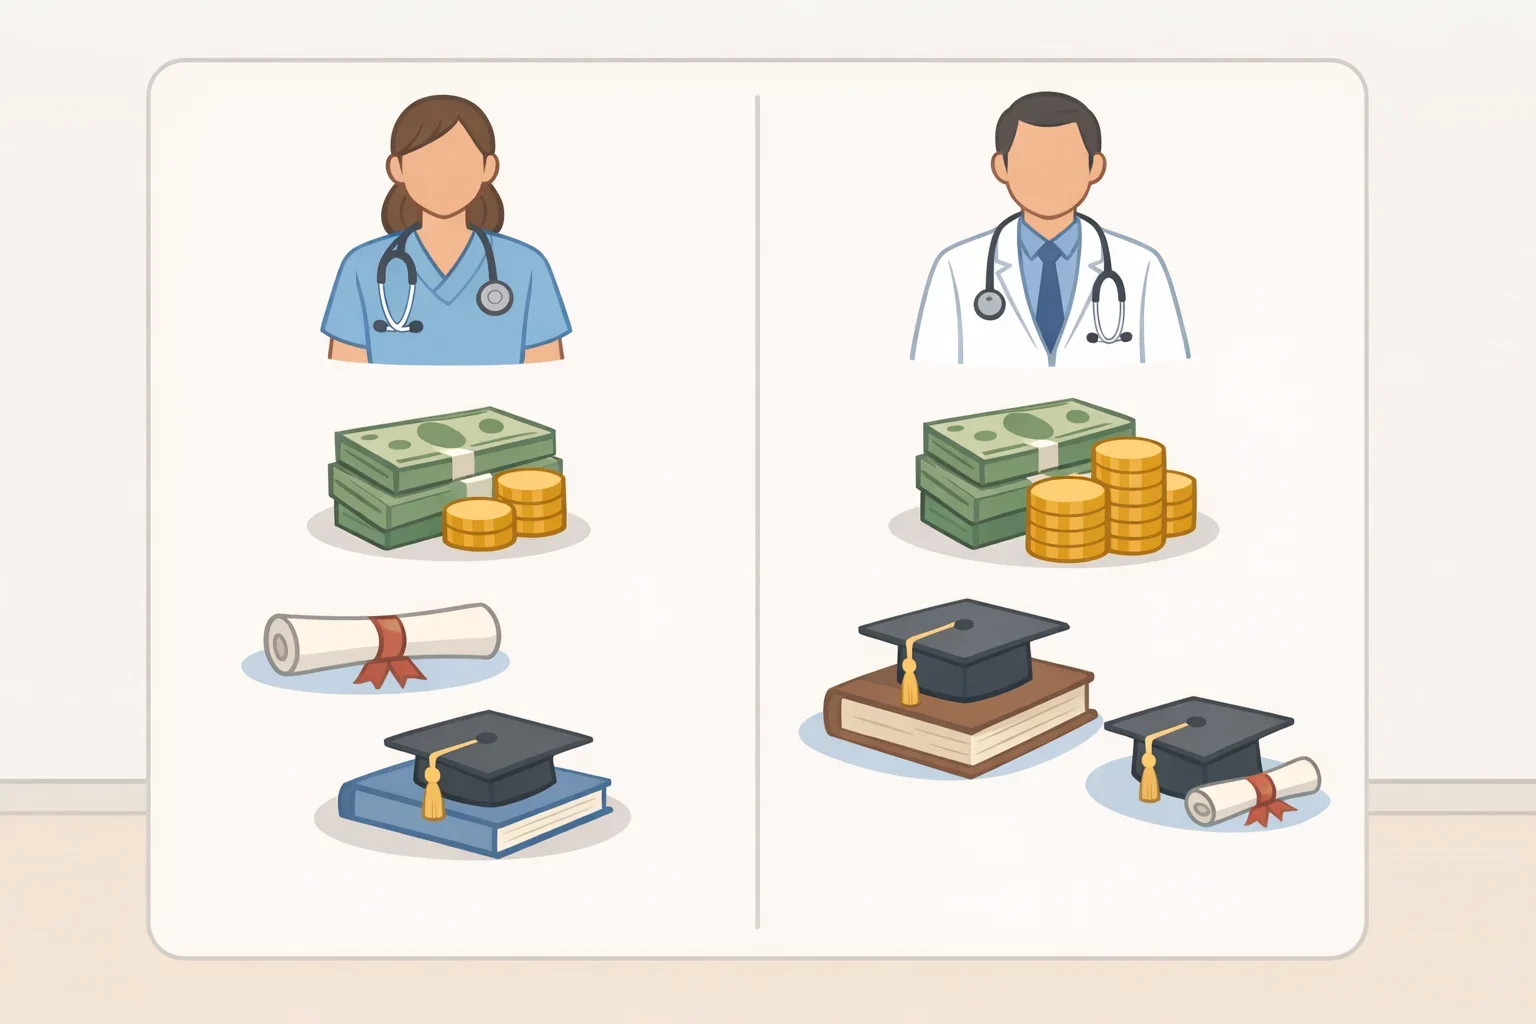
Registered nurses and physicians both fall under the BLS category "healthcare practitioners and technical occupations," which posted a median annual wage of $83,090 in May 2024, well above the $49,500 median for all occupations (BLS). That figure describes the category as a whole, not RN pay or physician pay specifically. Anyone researching nursing pay in particular should confirm the RN-specific figure directly on BLS's Occupational Outlook Handbook entry for registered nurses rather than relying on the category median.
Physicians and surgeons differ from that category figure in two clear ways: pay and typical education. BLS reports physician pay at or above $239,200 annually, with a doctoral or professional degree as the typical entry credential (BLS). That's a sharp divergence from the category median, and the sources reviewed for this article don't include a comparable RN-specific training cost or timeline, so that side of the comparison would need separate research.
Task mix likely differs between the two roles as well, but the OECD and BLS material reviewed here doesn't score either role's specific duties for AI exposure. Confirming that would take separate research into current job descriptions and clinical scope of practice, not an assumption based on job title alone.
Licensing works differently for each role too. Confirming current requirements for either one means checking directly with the applicable state licensing authority, since requirements and timelines can vary by state and the material reviewed here doesn't detail specific licensing pathways for either occupation.
Sector-wide, about 1.9 million healthcare openings are projected each year from a combination of employment growth and the need to replace workers who leave the field (BLS). That figure spans both practitioner roles, like RNs and physicians, and lower-paid support occupations such as home health aides, so it shouldn't be read as demand specific to nursing or physician positions.
What to verify before the next career move
The OECD measure doesn't answer whether one particular occupation is safe from AI, but it does point to a pattern worth checking: current systems remain furthest from work requiring contextual judgment, interpersonal understanding, complex decision making, and responsibility (OECD). That's a starting question to check against a specific role's actual duties, not a published list of protected jobs.
A single exposure score wouldn't have answered the separate questions of pay, training, licensing, or local demand anyway. Before treating any high-paying career as decided on AI-resistance grounds, pull the target occupation's task list from O*NET, confirm licensing rules with the applicable state board, check that occupation's specific BLS wage page rather than a broader category figure, and compare at least two current local job postings against national wage and projection data.
