
- US jobless claims drop to 196,000: what it means
- US jobless claims drop to 196,000: What the weekly data measure
- Why initial unemployment claims fell
- Continuing unemployment claims show a slower path back to work
- Fewer layoffs do not necessarily mean faster hiring
- Benefit duration varies by state
- What job seekers and workers should watch next
US jobless claims drop to 196,000: what it means
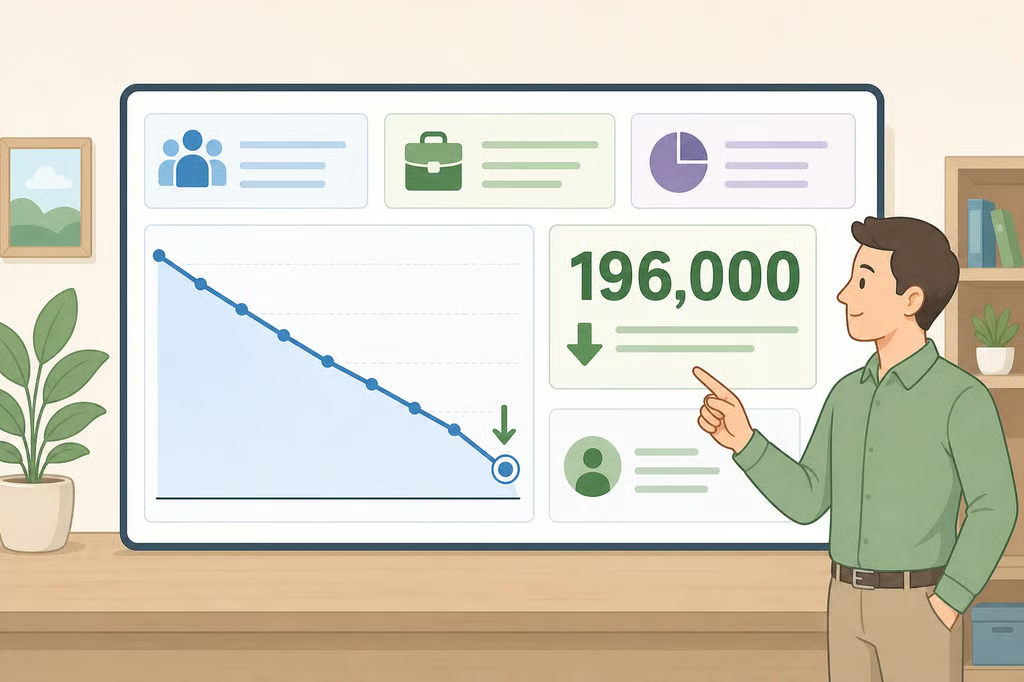
US jobless claims drop to 196,000 for the week ended September 12, down from 206,000 the previous week and below forecasts of 206,000 to 207,500, according to Haver Analytics and ABC News. It was the lowest weekly reading since mid-July.
The decline suggests fewer people entered the unemployment insurance system, but it does not necessarily mean unemployed workers are finding jobs more quickly. For job seekers, workers concerned about layoffs, and people receiving benefits, the useful question is what the report measures, and what it leaves out.
The four-week average, which smooths out week-to-week swings, fell to 203,250. Claims have mostly stayed within a historically low range of 200,000 to 230,000 a week over the past year, according to Haver Analytics and ABC News. That makes 196,000 a notable reading, but not proof of a major change in hiring conditions.
US jobless claims drop to 196,000: What the weekly data measure
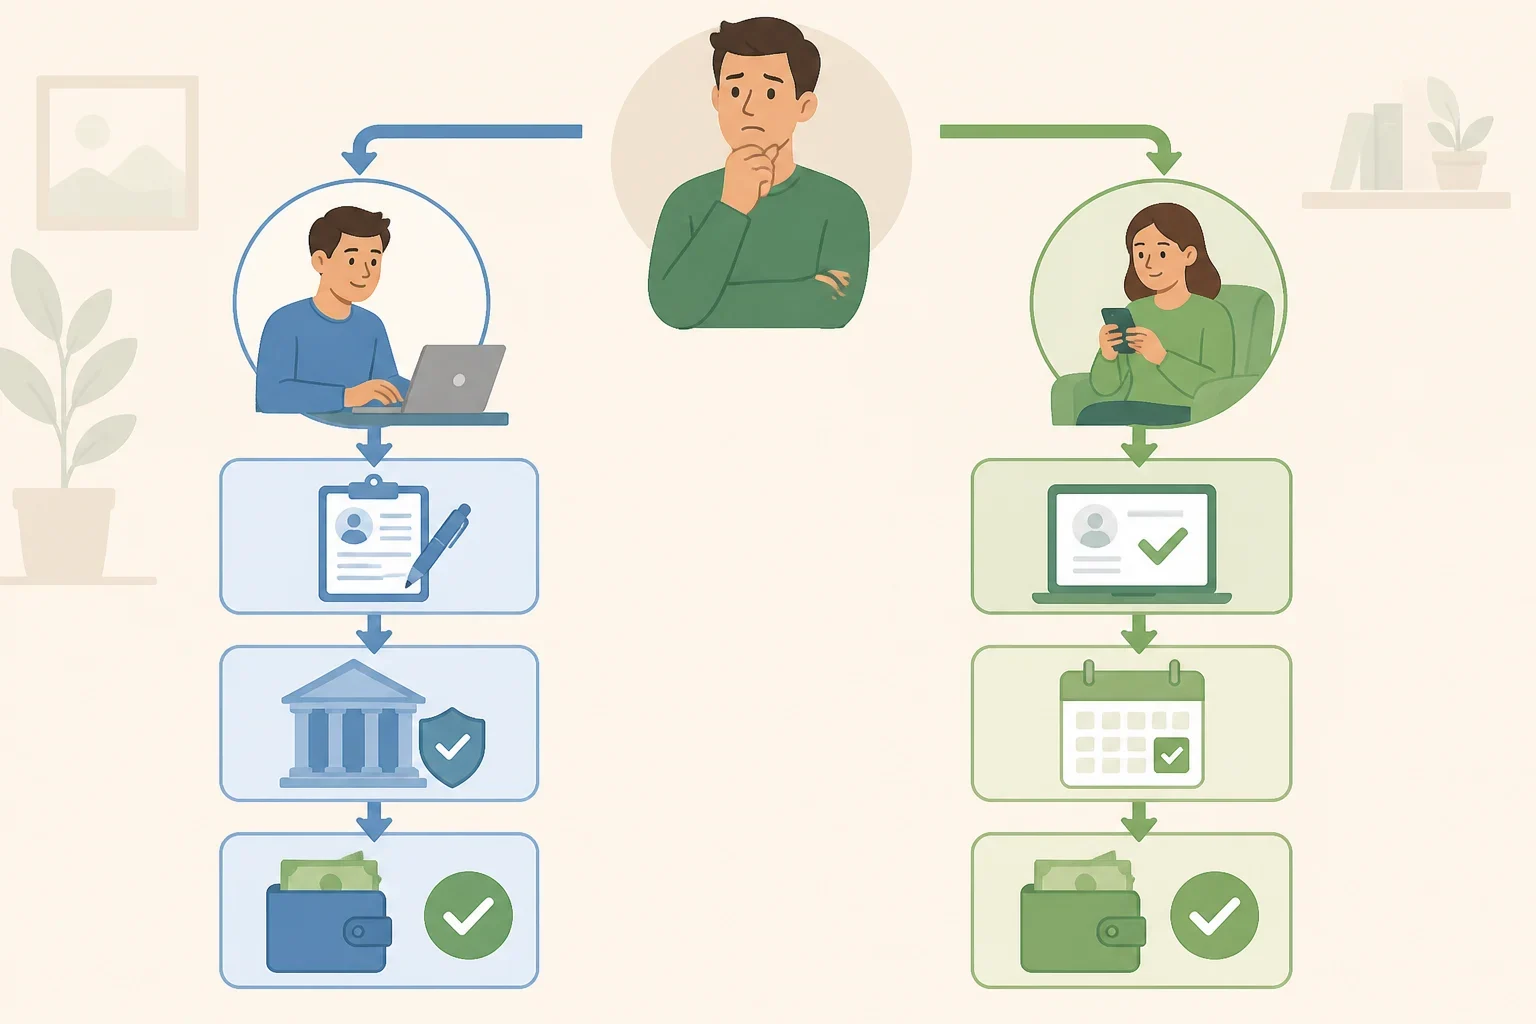
The Labor Department publishes two main weekly unemployment insurance measures. Initial claims count new applications for state unemployment benefits, while continuing claims count people who remain on benefits from one week to the next, according to a July analysis by the Richmond Fed.
That distinction matters. A decline in initial claims means fewer people entered the benefit system during the week. It does not count every unemployed person, measure every new hire, or show whether people already receiving benefits found work, stopped claiming for another reason, or exhausted their eligibility.
The weekly claims figures come from the Department of Labor, not the Bureau of Labor Statistics, according to Haver Analytics. Only about one-quarter to one-third of unemployed people draw benefits, so the data describe a specific group, including job losers with sufficient earnings history, rather than unemployed workers generally, according to the Richmond Fed.
That leaves out many people who may be looking for work, including some first-time job seekers, self-employed workers, and people who do not qualify for or have exhausted benefits. A national claims total therefore describes movement through the insurance system, not the full size or experience of unemployment.
Why initial unemployment claims fell
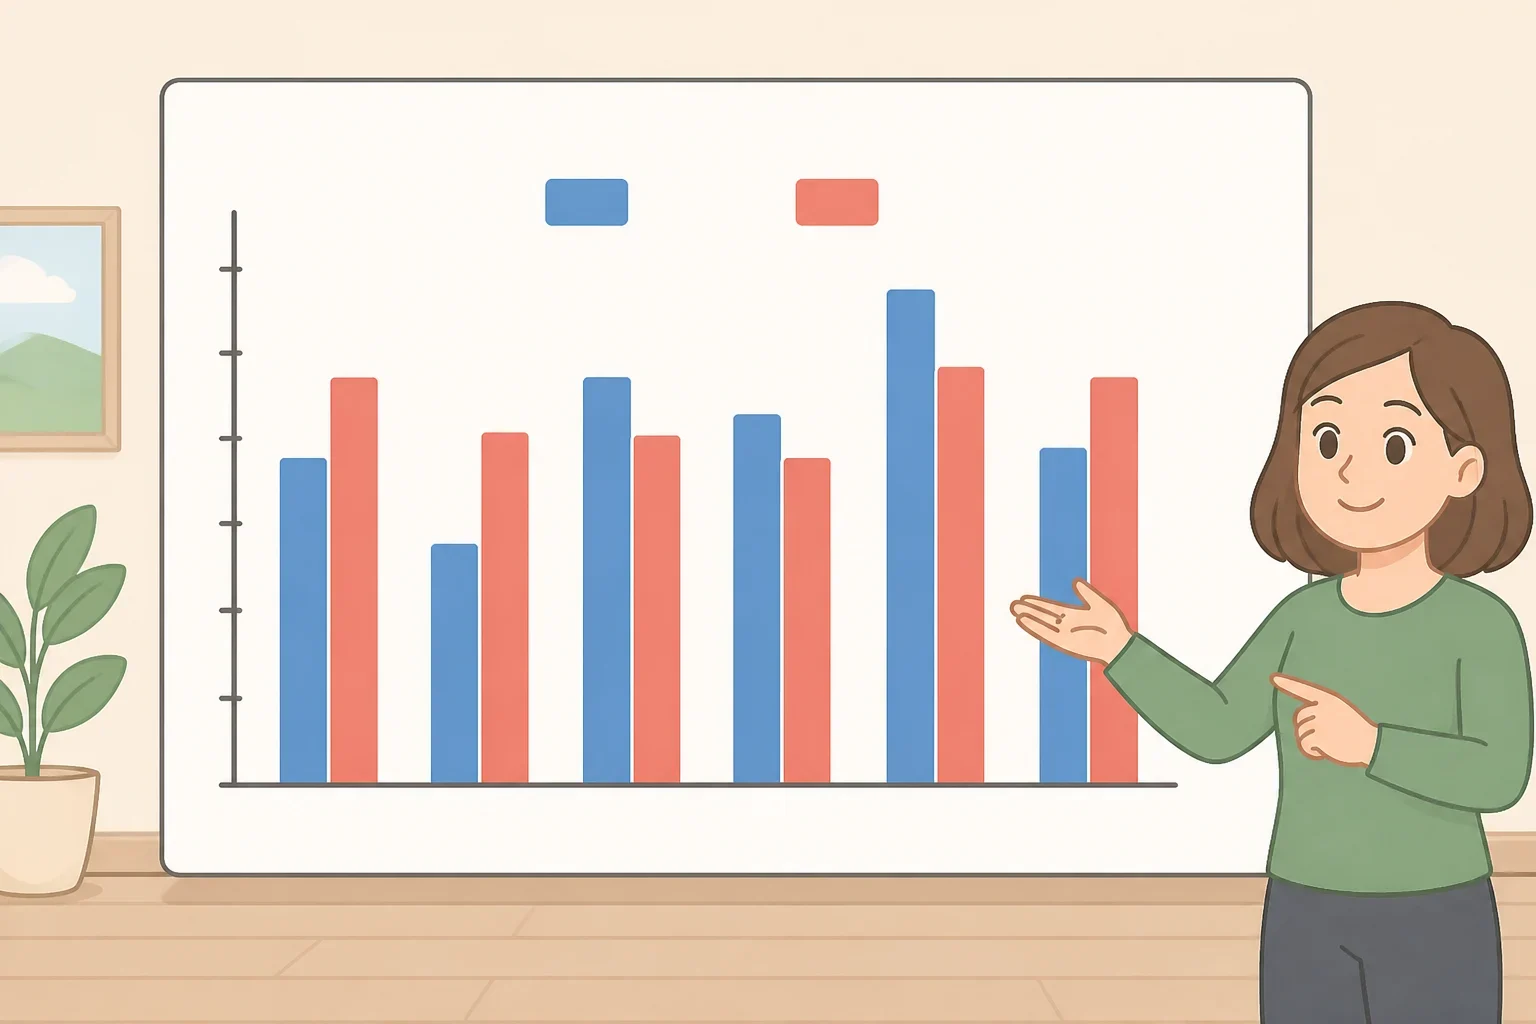
Initial claims fell by 10,000 to a seasonally adjusted 196,000 from an unrevised 206,000 the previous week, according to Haver Analytics. The four-week average fell to 203,250, also from 206,000, according to the same report.
The result was below the forecasts cited in the available reports. The Action Economics/Haver Analytics survey expected 206,000 claims, while a FactSet survey cited by ABC News expected 207,500.
A single weekly report can move for reasons that do not reflect a lasting change in the labor market. Claims have remained largely range-bound between 200,000 and 230,000, according to Haver Analytics. Workers assessing job security should watch the four-week average and the next several reports rather than treating 196,000 as a turning point.
Continuing unemployment claims show a slower path back to work
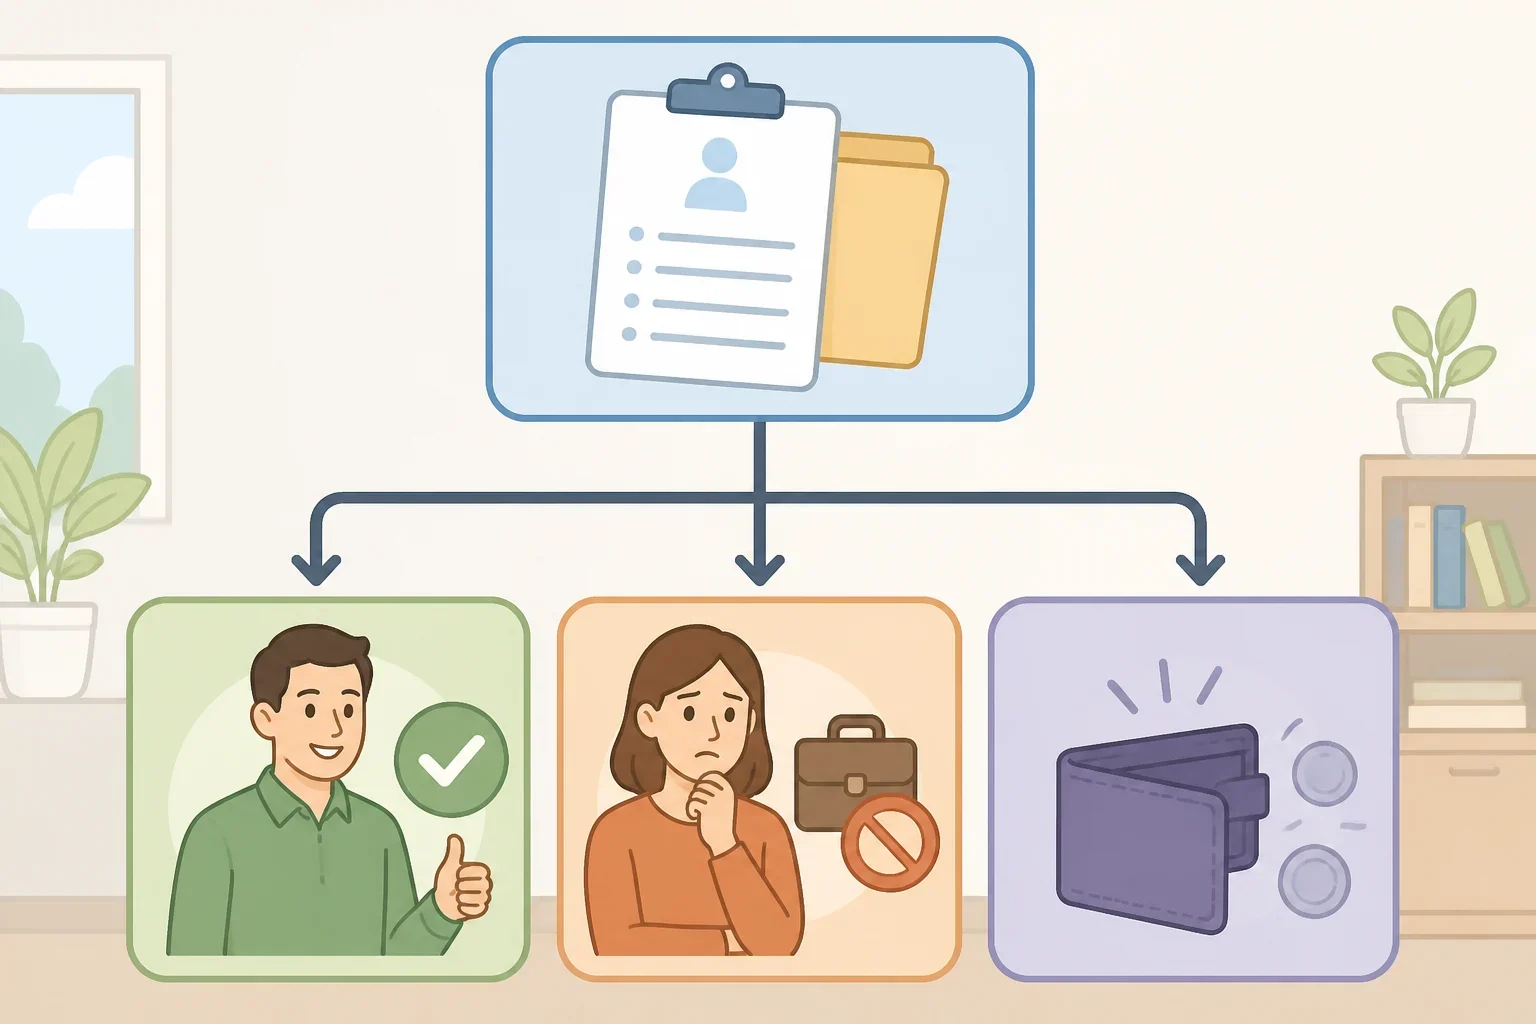
Continuing claims fell by 39,000 to 1.730 million for the week ended September 5. The insured unemployment rate edged down to 1.1%, its first decline since the week ended April 25, according to Haver Analytics.
Fewer people remaining on benefits can sound encouraging, but continuing claims do not reveal why every claimant leaves the rolls. People may find jobs, stop claiming without finding work, or reach the end of their benefits.
The weekly share of claimants leaving benefits for a job fell from 9.1% in 2022 to 6.8% over the 12 months ending in June 2026, according to the Richmond Fed. The share leaving without a job fell from 5.3% to 4.2%, while the share exhausting benefits rose from 0.5% to 0.9% over the same comparison, according to the same analysis.
The typical recorded benefit spell reached 8.2 weeks, compared with 6.5 weeks in 2022, according to the Richmond Fed. That 8.2-week figure is a floor, not a complete estimate, because continuing claims cannot count people who remain unemployed after their state benefit limit ends.
Fewer layoffs do not necessarily mean faster hiring
The broader employment figures present a mixed picture. Employers added an average of 80,000 jobs a month during 2026, including 162,000 in August, according to ABC News.
That pace is stronger than the 9,700 monthly average in 2025, but it remains below the average of 166,000 jobs a month in 2023 and 2024. It is also well below the 491,000 monthly average recorded during the 2021-2022 hiring boom, according to ABC News.
A July analysis from the Richmond Fed helps explain why continuing claims can fall without a clear improvement for people already unemployed. Continuing claims rose by 560,000 between July 2022 and August 2025, then fell by 149,000 from August 2025 through June 2026.
For the later decline, the Richmond Fed model found that holding the exit rate at its mid-2025 level while using observed arrivals reproduced 142,000 of the 149,000 decline. Holding arrivals fixed reproduced only 14,000, according to the Richmond Fed.
The practical reading is narrow but important: fewer people have been entering the unemployment insurance rolls, while existing claimants have not been leaving for jobs at the faster rate recorded in 2022. Someone actively searching should plan for a potentially longer process instead of assuming that low initial claims will quickly improve placement odds.
Benefit duration varies by state
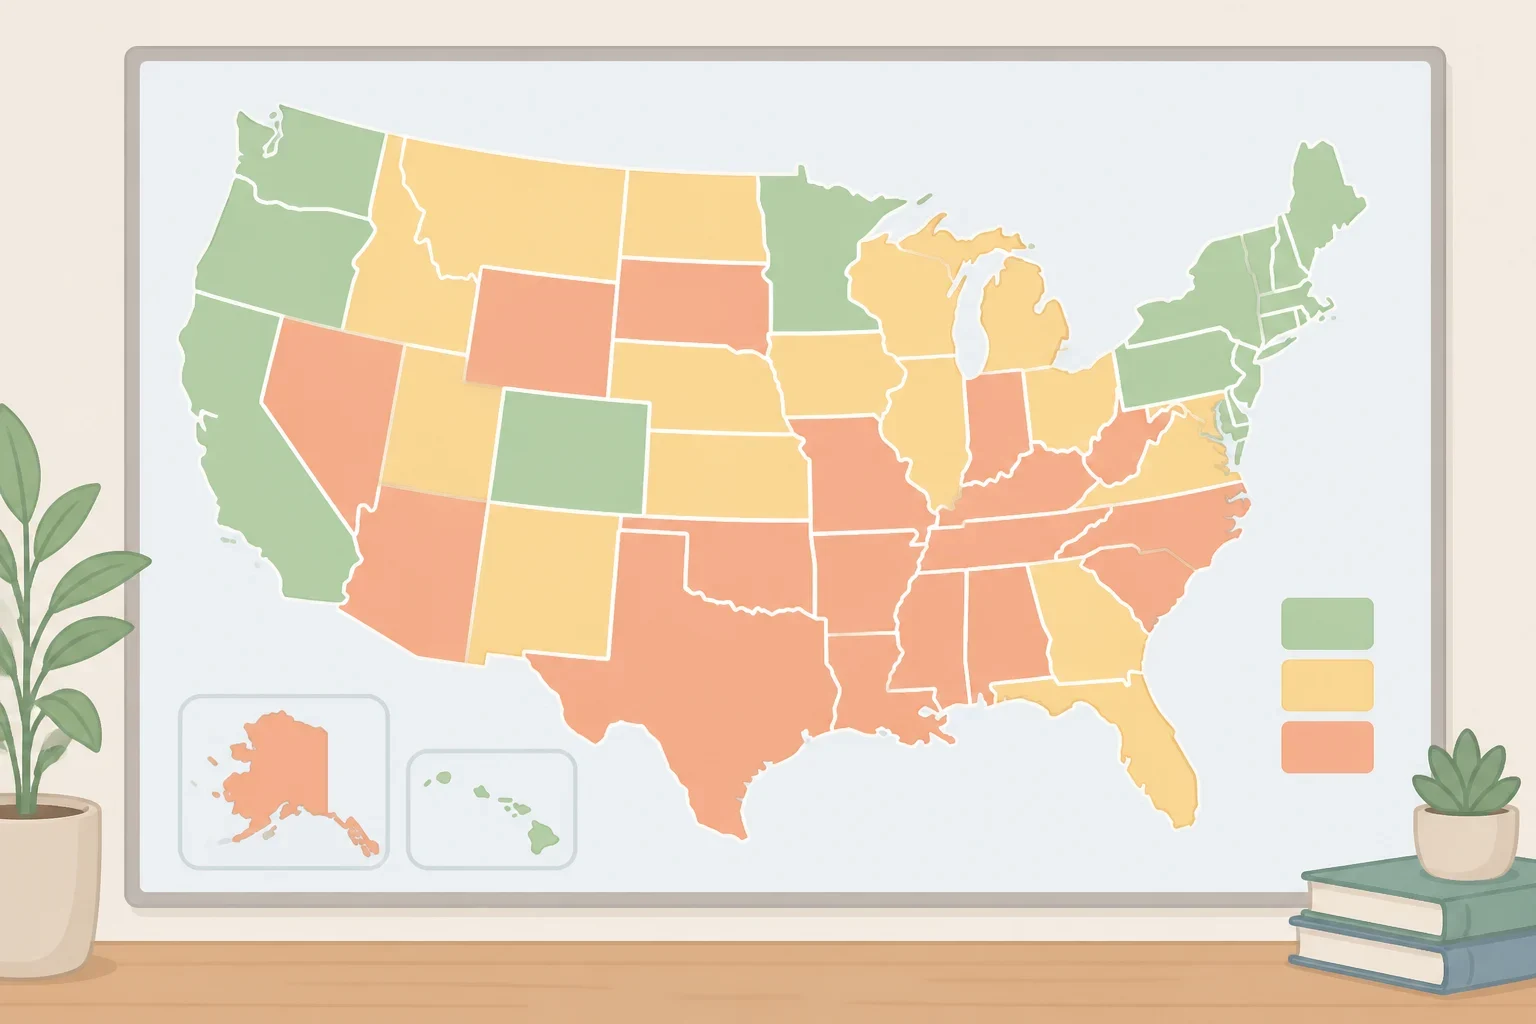
The national report also hides major differences in how long workers can remain on unemployment benefits. Benefits are capped below 26 weeks in 16 states, while five states cap them at 12 weeks, according to the Richmond Fed.
In those five states, nearly half of exits from the benefit rolls are caused by exhaustion rather than another type of exit, according to the Richmond Fed. Across all states, benefit exhaustion accounted for 3.3% of exits in 2022 and 7.3% over the 12 months through June 2026, more than doubling over that period.
State insured unemployment rates vary as well. For the week ended August 29, the rates ranged from 0.21% in South Dakota to 2.58% in New Jersey, with California at 1.78%, according to Haver Analytics. Those figures were not seasonally adjusted and reflect people receiving benefits, not every unemployed worker in each state.
What job seekers and workers should watch next
The immediate news is clear: initial unemployment claims fell to 196,000, the four-week average declined to 203,250, and continuing claims also fell. The less certain question is whether the latest drop will persist or whether weekly volatility will push claims back toward their recent range.
For job seekers, the report is not a reason to pause applications or assume hiring has accelerated. Track the next several weekly claims reports alongside broader employment data, and judge opportunities based on the roles, employers, and locations relevant to your search.
Workers receiving unemployment benefits should check their state labor department’s rules for benefit duration, reporting, and exhaustion. National claims data can provide context, but it cannot tell an individual worker how long benefits will last or whether that person qualifies.
